
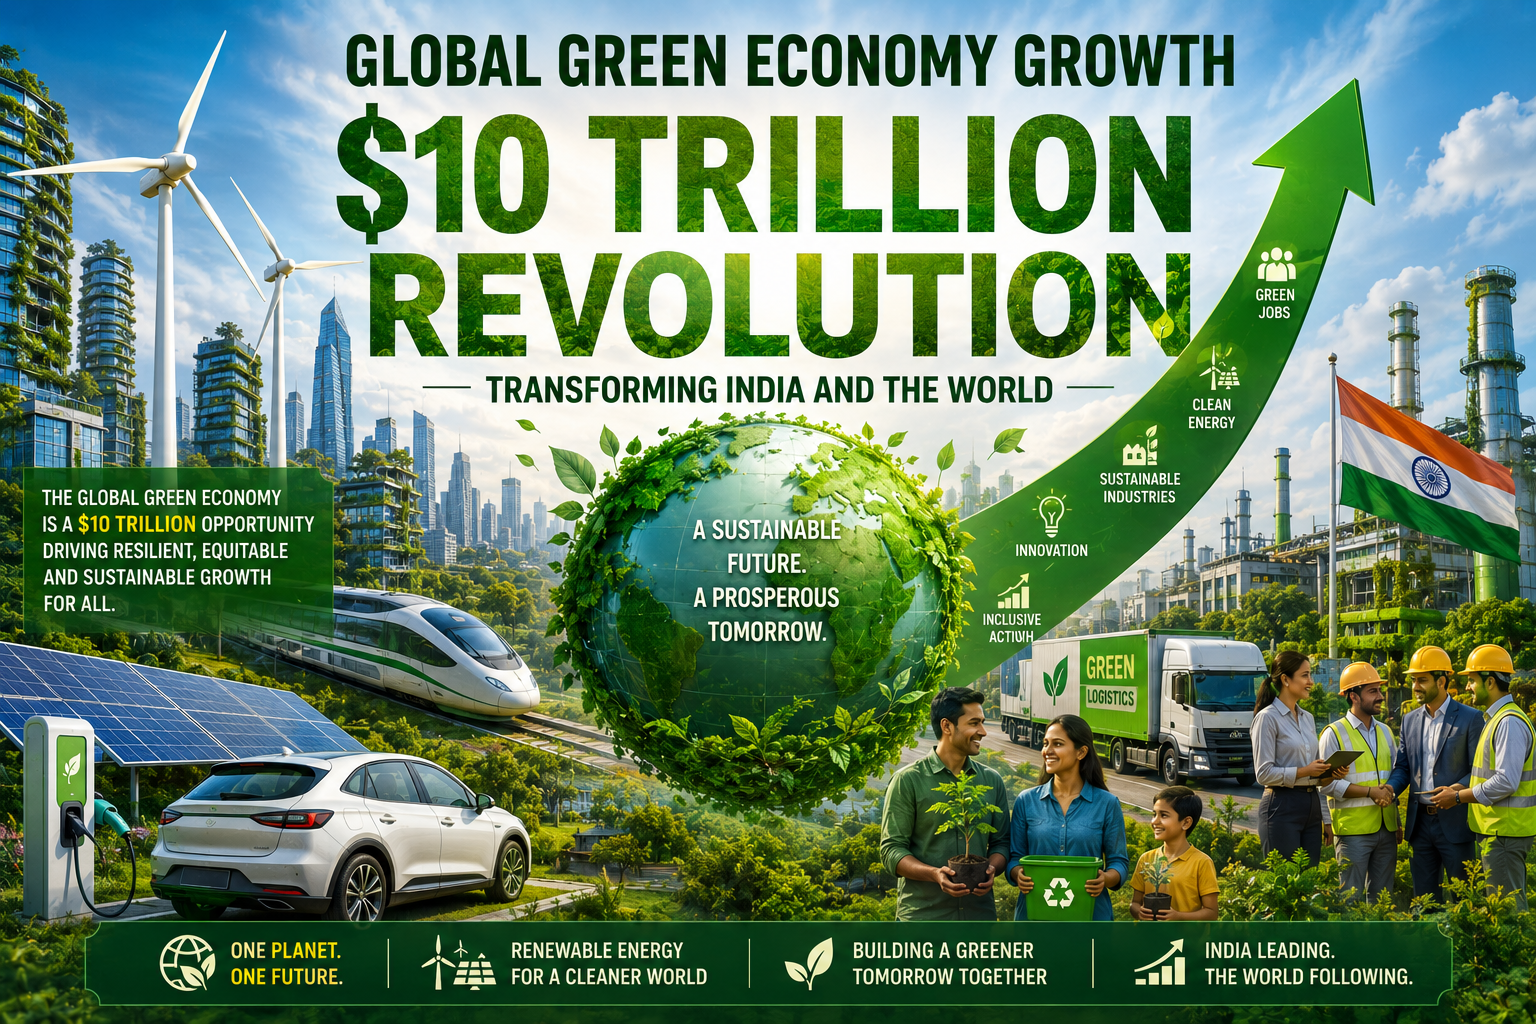
Global green economy growth has officially crossed an extraordinary milestone, signaling a structural transformation in how businesses operate, how capital is allocated, and how nations build economic resilience. According to the London Stock Exchange Group’s (LSEG) definitive Investing in the Green Economy 2026 report, the aggregate market capitalization of companies driving the transition to environmental sustainability has crossed the $10 trillion threshold. If it were a standalone sector, this massive green ecosystem would now rank as the third-largest industry on Earth, eclipsing healthcare and trailing only technology and heavy industrials.
This dramatic boom is occurring against a backdrop of deep structural changes. No longer a peripheral concern driven purely by corporate social responsibility or regulatory box-checking, sustainability has emerged as a frontline battleground for macroeconomic competitiveness and sovereign energy security. For dynamic markets like India and mature economic blocks like the United States and Europe, green production and clean-energy infrastructure are reshaping the corporate landscape.
The Big Picture: A Sector-Defying $10 Trillion Footprint
The global green economy is booming like never before. By early 2026, green companies made up 9.9% of all public stock markets worldwide. This means nearly $1 out of every $10 invested globally is now going directly into sustainability and clean energy.
Key Highlights:
Trillions in Revenue: Last year, global green revenues grew by 5.3% to a massive $5.5 trillion. Out of 133 different green categories tracked, 99 saw major growth.
Higher Profits: Green stocks are beating the regular market. A major index of green companies outperformed standard global stocks by 12.4% over the past year.
Long-Term Success: Since 2008, green businesses have grown at an average yearly rate of 18%, while regular markets grew at just 12%.
Rapid Acceleration: Between 2023 and 2026, the green economy grew twice as fast as it did in the previous three years.
In short, thousands of major companies are rapidly shifting their business models because going green has become incredibly profitable.
India’s Dual Narrative: A Hyper-Growth Dynamo and Niche Superpower
Within this global transformation, India has emerged as one of Asia’s most compelling growth narratives. The LSEG report notes that India generated a substantial $110 billion in green revenues in 2025. While its aggregate base remains relatively modest when stacked against regional behemoths like China or Japan, India’s trajectory is nothing short of spectacular.
Over the past five years, India’s green revenues scaled up at a blistering compound annual growth rate (CAGR) of 20%. This hyper-growth outpaced Asia’s regional green revenue growth of 12% and effectively doubled the global market’s 10% CAGR over the identical time frame.
Green Revenue Compound Annual Growth Rate (CAGR) Comparison:
=============================================================
India:          [████████████████████] 20%
Asia Regional:  [████████████] 12%
Global Market:  [██████████] 10%
The underlying data points to a highly distinct structural character for India’s sustainable market. Rather than competing head-to-head in capital-intensive consumer electronics or heavy supply chain domains, India has built dominant, asymmetric positions in niche green economy sectors deeply tied to rural development, waste-to-energy ecosystems, and decentralized agrarian infrastructure.
Remarkably, India accounted for a staggering 87% of all green revenues across Asia in the field of biogas energy equipment. This highlights the country’s deep, highly localized success in converting agricultural waste into viable commercial power. Furthermore, India captured 75% of Asia’s green revenue in advanced irrigation systems and water-saving devices. This achievement underscores the rapid modernization of its massive agricultural sector, where tech-driven water conservation has become a commercial necessity in the face of climate volatility.
However, from a macro-perspective, India remains an agile challenger in the broader Asian theater. Asia has officially cemented its status as the world’s powerhouse for sustainable manufacturing and infrastructure, with Asian firms commanding a massive 47% share of all global green revenues. Within this ultra-competitive region, the market share distribution remains heavily consolidated:
China: 41% of regional green revenues
Japan: 28%
Hong Kong: 10%
South Korea: 6%
Taiwan: 5%
India: ~4%
Despite its 4% regional volume share, India is punching well above its weight in capital commitment. The country deployed a monumental $100 billion in clean-energy investments over the course of 2025 alone. This investment represented a breathtaking 83% of India’s entire capital allocation for the power sector, highlighting a systemic shift away from fossil-fueled infrastructure pipelines.
The most crucial issue: Striking a balance between clean energy and energy security.
The explosive trajectory of global green economy growth cannot mask the complex realities of energy security that national governments must manage daily. While clean energy deployment is breaking records, Asia as a whole continues to face the monumental challenge of balancing aggressive decarbonization targets with absolute economic survival.
Asia remains profoundly dependent on imported fossil fuels, particularly oil and gas sourced from the Middle East. At the same time, the region continues to act as the primary engine for global coal demand, a reality led directly by China, followed closely by India and the rapidly industrializing nations of Southeast Asia.
For India, this creates a complex dual reality. The country is a fast-moving, high-performing player in the listed green revenue pool, but it must simultaneously run legacy thermal operations to ensure uninterrupted power for its grid. The LSEG report emphasizes that the path forward for these emerging economic giants involves leveraging green growth not merely as an emissions-reduction strategy, but as an active tool for sovereign independence. Decentralized systems like biomass, localized microgrids, and highly optimized irrigation directly lower a nation’s reliance on volatile international commodity supply chains, proving that climate action and national security are increasingly two sides of the same coin.
Corporate Tech Titans and the American Market Fortress
Even though Asia has the highest number of green companies, the United States is still the world leader in green market value. The US holds a massive 57% of the global green market value.
This shows that the shift to clean energy is now being driven by business profits, not just government laws or politics.
Big Tech as the Main Driver:
The Power of Four: In 2025, just four massive technology companies—Meta, Amazon, Google, and Microsoft—bought 49% of all corporate clean energy deals worldwide.
Why They Need It: These tech giants need huge amounts of electricity to run next-generation artificial intelligence (AI), giant data centers, and global cloud networks.
Stable Future: Because these tech companies are buying clean energy at the same scale as entire countries, green developers have a steady, guaranteed income. This protects the green sector from changing political rules.
Mega-Deals and Wall Street Capital: The Power Shift in M&A and Debt Markets
As sustainable business models prove their long-term profitability, the global financial plumbing has adjusted accordingly. The capital flowing into green mergers and acquisitions (M&A) over the past decade reached a cumulative total of $4.1 trillion, representing 13.4% of all global deal-making during that ten-year window.
In 2025 alone, green M&A activity reached $308 billion, representing 12.6% of total global transaction values. Because green projects require intense, front-loaded capital investments to build infrastructure that yields near-zero marginal operational costs, these transactions are inherently larger than traditional corporate deals. Between 2023 and 2025, the average green deal size stood at a substantial $257 million, compared to a modest $150 million average for non-green transactions.
Average Global Corporate Deal Size (2023 - 2025):
=================================================
Green Transactions:     [█████████████████████████] $257 Million
Non-Green Transactions: [███████████████] $150 Million
The data also reveals a fascinating consolidation trend: green M&A is being driven almost entirely by companies that are already deeply embedded in the sustainable ecosystem. Only 4% of traditional, purely non-green corporate buyers stepped forward to purchase green assets. The vast majority of consolidation is happening internally, led by industrial and utility majors expanding their clean energy portfolios. The industrials and utilities sectors accounted for over half of total green deal values, hitting $176 billion. Remarkably, within the utility sector specifically, green transactions now account for a dominant 71% of all deal value.
Simultaneously, the fixed-income markets are witnessing structural shifts. Global green bond issuances hit a record high of $605 billion in 2025, a 5.7% year-on-year increase. Corporate issuers led the charge, accounting for 68% of these new bond instruments. When analyzing the $3.3 trillion in total outstanding green bonds globally as of the first quarter of 2026, the data shows that “Energy Management and Efficiency” has emerged as the single largest sector, capturing a 34% share of total outstanding debt finance.
The 50% Threshold: Crucial Performance Disparities in the Transition
One of the most valuable insights delivered by LSEG’s analysis is the stark reality regarding corporate profitability during the green transition. The data reveals that greening a company is not a linear path to immediate financial success; rather, it requires commitment to reach scale.
When evaluated against 4,000 global peers on the FTSE indices, companies that have successfully transitioned to generating more than 50% of their revenues from green products and services deliver exceptional financial results. These pure-play or deep-green firms generate earnings before interest, taxes, depreciation, and amortization (EBITDA) margins that are 2 to 4 percentage points higher than their non-green peers.
Corporate Financial Performance Matrix (EBITDA Margin Variance):
================================================================
Pure/Deep Green (>50% Green Rev):   [+2% to +4% Margin Outperformance]
Early-Stage Green (<50% Green Rev): [Underperformance vs Non-Green Peers]
Conversely, firms that are in the early or middle stages of transition—generating less than 50% of their revenues from sustainable business lines—frequently underperform their legacy, non-green competitors. LSEG analysts suggest this performance dip reflects the heavy friction, upfront capital expenditures, and operational duplicate costs associated with early-stage corporate diversification and structural transformation.
This finding carries vital strategic lessons for executive boardrooms globally. Incremental or superficial adjustments to a business model may yield a temporary public relations benefit, but they often result in financial drag. True financial outperformance is unlocked only when an enterprise pushes past the 50% inflection point, achieving the true economies of scale required to thrive in the modern economy.
Conclusion: The Horizon of Competitiveness
The message from the global capital markets is clear: the green transition has entered a mature phase. As Jaakko Kooroshy, LSEG’s Global Head of Sustainable Investment Research, noted, the market is now defined as much by energy security and economic competitiveness as it is by decarbonization.
For India, the path forward is clear. By leveraging its rapid growth rate and building dominant positions in crucial industrial niches like agricultural technology and waste recovery, the nation is carving out a highly resilient position within the broader global framework. Meanwhile, as global green market values hold firm above the $10 trillion mark, the businesses and nations that scale up their green revenue bases beyond the critical 50% threshold are positioned to lead the global economy for decades to come.