

Mutual fund industry outflows took center stage in the latest asset allocation data released by the Association of Mutual Funds in India (AMFI). Market observers often glance at a single headline number and draw sweeping conclusions about retail investor sentiment. However, a deeper layer-by-layer examination of the financial ecosystem shows that large-scale macro numbers are rarely driven by individual retail actions alone. Instead, they are frequently the result of structural corporate cycles, treasury behavior, and seasonal liquidity demands.
The June AMFI disclosures present a fascinating paradox. On one side of the ledger, domestic retail participation in equity markets via systemic investment routes remained resilient, with fresh capital actively moving into equities, hybrid asset classes, and commodities. Yet, when all categories were consolidated, the collective balance sheet recorded an aggregate net outflow.
To fully understand this shift, this report breaks down the underlying forces, dissects category-wise performance, and analyzes why the headline movement does not necessarily indicate a broader flight of capital from the markets.
The Macro Paradox: Why Inflows and Rising AUM Met Total Outflows
During the month of June, the Indian mutual fund landscape recorded a collective net outflow of Rs 52,949 crore. While an initial look at this figure might suggest a market contraction, it actually marks a sequential improvement from the previous month, where net outflows reached Rs 64,131 crore (with some internal metrics positioning it around Rs 64,021 crore).
[May Net Outflows] ──► Rs 64,131 crore
                             │
                             ▼ (Sequential Improvement)
[June Net Outflows] ──► Rs 52,949 crore
The underlying health of the asset ecosystem is highlighted by a key metric: total Assets Under Management (AUM). Despite a net exit of absolute cash from the collective pool, the industry’s total AUM climbed to Rs 82.22 lakh crore by the end of June, up from Rs 81.6 lakh crore a month prior.
| Parameter | May Performance | June Performance | Trend Direction |
| Net Industry Flow | Rs 64,131 crore Outflow | Rs 52,949 crore Outflow | Marginal Recovery |
| Total Industry AUM | Rs 81.60 lakh crore | Rs 82.22 lakh crore | Expansion |
This divergence—where aggregate AUM expands despite a net drop in monthly cash volume—stems from a combination of market appreciation across equity assets and a structural difference between long-term investment capital and short-term corporate treasury movements. The capital leaving the system belonged to highly liquid, low-yield institutional instruments, while the money entering was high-conviction retail capital, which was augmented by market mark-to-market gains.
The Core Driver: Debt Schemes and Quarter-End Liquidity
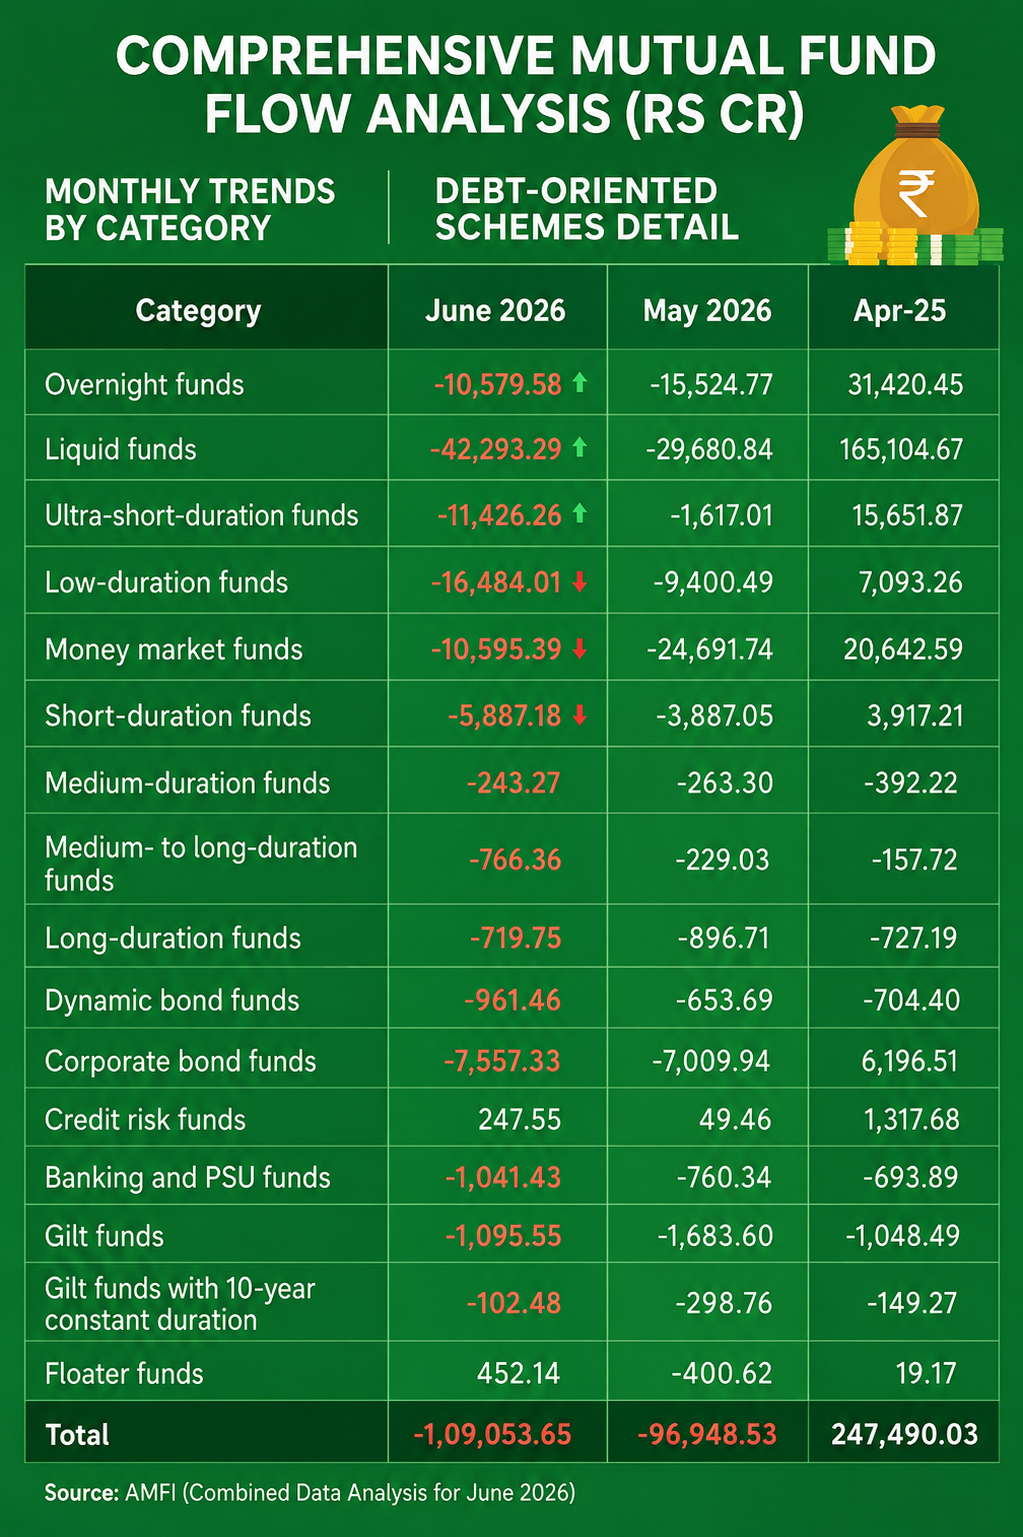
The primary factor behind the net negative headline numbers was the fixed-income market segment. Debt-oriented mutual fund schemes saw a substantial collective withdrawal of Rs 1.09 lakh crore (specifically Rs 1,09,053 crore) during June. This marks the second consecutive month where fixed-income options faced net redemptions, following a net outflow of Rs 96,948 crore in May.
“Debt-oriented schemes recorded a substantial net outflow of Rs 1,09,053 crore in June, primarily driven by heavy redemptions in ultra-short-term categories to meet predictable, seasonal quarter-end institutional liquidity requirements,” observed Umesh Sharma, CIO of Debt at The Wealth Company Mutual Fund. “However, what was interesting was redemption in schemes like short duration and corporate bond funds etc. despite expectation of these schemes doing well post measures announced by RBI Monetary Policy Committee (MPC).”
To put these sharp shifts into context, fixed-income flows often look like a pendulum over a three-month corporate calendar cycle:
April: Debt products attracted a major net influx of Rs 2.47 lakh crore as corporate treasuries reinvested their capital at the start of the new fiscal year.
May: The trend reversed into a net withdrawal of Rs 96,948 crore.
June: Withdrawals accelerated to Rs 1.09 lakh crore due to quarter-end obligations.
These heavy institutional withdrawals are typically tied to seasonal corporate cycles, such as quarterly advance tax obligations, balance sheet formatting, and regulatory liquidity maintenance by banking entities, rather than a fundamental shift in retail investor sentiment.
Category Analysis: Short-Duration Fixed Income
Looking closer at the debt segment shows that the selling pressure was highly concentrated in short-duration, highly liquid cash equivalents. Corporate treasuries and institutional desks used these short-term instruments as temporary parking spaces for their operational funds.
Short-Term Outflows
Liquid Funds: This category saw the largest overall reduction, with net redemptions reaching Rs 42,293 crore. These products act as primary cash management tools for enterprise operations, making them highly sensitive to corporate tax calendars.
Low-Duration Funds: Investors withdrew a net total of Rs 16,484 crore from this segment.
Ultra-Short-Duration Funds: Experienced a net contraction of Rs 11,426 crore.
Money Market & Overnight Funds: These institutional categories faced similar redemption pressure, with money market funds losing Rs 10,595 crore and overnight platforms seeing a net exit of Rs 10,580 crore.
Corporate Bond & Short-Duration Funds: High-quality corporate bonds recorded a net exit of Rs 7,557 crore, while short-duration products saw an outflow of Rs 5,887 crore.
Nitin Agrawal, CEO of Mutual Funds at InCred Money, noted that this data needs to be evaluated in context. He pointed out that because the bulk of redemptions came from liquid, overnight, and money market funds, these movements reflect standard corporate treasury cycles and corporate tax payment schedules rather than a broader structural change in underlying investor confidence.
The Exceptions: Categories Staying Positive
Out of all the fixed-income sub-categories, only two managed to buck the broader redemption trend and post net positive inflows for the month:
Floater Funds: Attracted Rs 452 crore in fresh capital, as some investors sought protection against near-term yield fluctuations.
Credit Risk Funds: Brought in a modest Rs 248 crore.
Meanwhile, long-term sovereign products remained under minor pressure. Gilt funds posted a net loss of Rs 1,096 crore, while Banking & PSU debt options, dynamic bond funds, and dedicated long-duration products also ended the month in negative territory. The widespread nature of these redemptions suggests that institutional desks chose to pull capital out of the fixed-income segment altogether to meet liquid cash needs, rather than reallocating it into different debt products.
Equity Markets: Resilient Growth Amid Volatility
While fixed-income categories faced institutional outflows, the equity segment showed a very different trend. Net inflows into equity-oriented mutual fund schemes rose to Rs 28,973 crore in June. This represents a 26% sequential jump from the Rs 22,908 crore in net inflows recorded during May, showing steady retail commitment despite volatile market conditions.
[January Equity Inflow] ──► Rs 24,028 crore
[February Equity Inflow] ──► Rs 25,978 crore
[March Equity Inflow]    ──► Rs 40,450 crore
[April Equity Inflow]    ──► Rs 38,440 crore
[May Equity Inflow]      ──► Rs 22,908 crore
[June Equity Inflow]     ──► Rs 28,973 crore (26% M-o-M Jump)
Equity Sub-Category Inflows
Rather than focusing on large-cap safe havens, the monthly data shows that investors continued to direct capital toward mid- and small-cap segments.
Midcap Funds: Led the equity category by attracting Rs 6,090 crore in fresh investments.
Small Cap Funds: Followed closely behind, bringing in Rs 5,602 crore.
Flexi Cap Funds: Maintained popular appeal with net inflows of Rs 5,231 crore, offering a diversified approach across multi-cap allocations.
Large Cap Funds: Saw a lower but still positive net addition of Rs 2,067 crore.
The only notable exceptions to this equity growth trend were dividend yield strategies and Equity-Linked Savings Schemes (ELSS), both of which experienced net outflows. For ELSS in particular, minor post-tax-season profit-taking is common during this period of the fiscal year.
Hybrid Funds and Gold ETFs Provide Balanced Support
Beyond traditional equity structures, investors also adjusted their allocations in hybrid categories and gold-backed instruments. Gold Exchange Traded Funds (ETFs) saw a significant turnaround, bringing in a net positive inflow of Rs 3,443 crore for June. This stands in sharp contrast to May’s performance, which saw a net outflow of Rs 725 crore.
This shift toward gold indicates that investors are using precious metals as a tactical hedge against equity volatility and changing global economic signals. Similarly, hybrid asset allocation schemes continued to pull in steady, positive net numbers, helping to partially offset the large-scale institutional redemptions seen in the debt markets.
Key Industry Implications
The divergence between institutional debt liquidations and retail equity inflows highlights a few key takeaways for the broader market:
Retail Sentiment Remains Independent: The net outflow at the industry level does not mean retail investors are panicking or pulling out of the market. The growth in equity inflows and rising total AUM show that long-term retail capital remains steady.
Institutional Domination of Debt Numbers: Debt fund flows are heavily driven by large enterprises and corporate treasuries. Their regular cash management needs and tax timelines create sharp monthly swings that can easily obscure retail trends in headline reports.
A Shift in Risk Appetite: The strong demand for mid-cap, small-cap, and flexi-cap options shows that retail investors retain a healthy appetite for risk, even during more volatile market phases.
Ultimately, June’s asset flow data highlights a mature and multi-layered investment ecosystem. While institutional capital exited fixed-income products to fulfill short-term operational needs, individual retail capital continued its steady commitment to long-term equity compounding.
Disclaimer: The information provided above is for educational purposes only. We strongly advise investors to consult with SEBI-certified financial experts before making any investment decisions.