
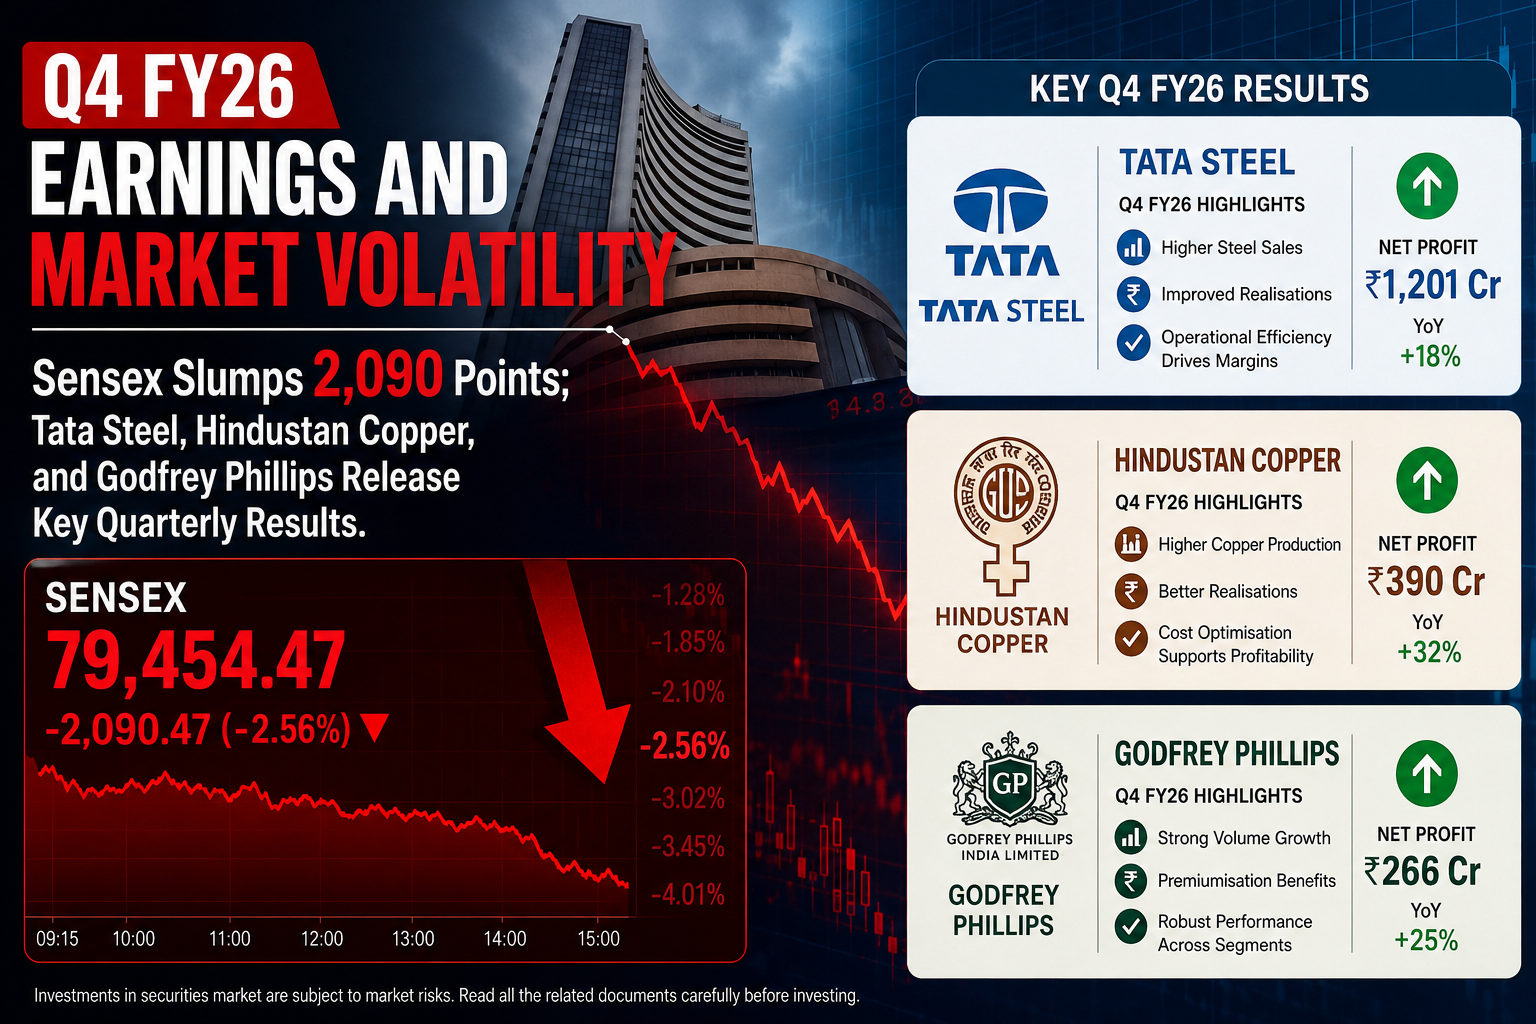
Q4 FY26 Earnings and Market Volatility on Friday, May 15, 2026, as a ferocious bear attack wiped out the entire gains of the past fortnight. The benchmark BSE SENSEX plummeted by over 2,090 points, leaving investors reeling from a widespread sell-off across all market capitalization tiers. This massive market correction coincided with a flurry of high-profile fourth-quarter (Q4FY26) earnings announcements from corporate heavyweights, including Tata Steel, Hindustan Copper, Godfrey Phillips, Welspun Living, and ITC Hotels.
While the macro indices painted a grim picture of capital flight and broken support levels, the corporate earnings landscape presented a fascinating contrast of explosive bottom-line growth, massive dividend announcements, strategic acquisitions, and multi-crore share buyback plans.
Q4 FY26 Earnings and Market Volatility : The Macro Overview
The trading session on May 15, 2026, will be remembered as one of the sharpest single-day corrections in recent times. The aggressive selling pressure was visible from the opening bell, with institutional investors shifting gears rapidly.
Friday, May 15 Net Institutional Trading Activity
| Institutional Segment | Net Investment Cash Flows (In ₹ Crores) |
| FII Cash Market | +1,329.17 |
| DII Cash Market | -1,958.82 |
| FII Index Futures | +1,393.18 |
| FII Index Options | -2,133.48 |
| FII Stock Futures | -1,198.43 |
| FII Stock Options | -31.71 |
Performance Breakdown of Major Indices
| Index | Closing Level | Absolute Change | Percentage Change |
| BSE SENSEX | 75,237.99 | -2,090.20 | -2.7% |
| NIFTY 50 | 23,643.50 | -532.65 | -2.2% |
| NIFTY Midcap 100 | 60,567.15 | -1,362.75 | -2.2% |
| NIFTY Smallcap 100 | 17,882.60 | -863.30 | -4.6% |
| INDIA VIX | 18.79 | -2.46 | -11.6% |
Corporate Earnings Scorecard: Q4 FY-2025-26 At A Glance
To help investors, traders, and analysts navigate through the massive influx of financial data released after market hours on Friday, here is a comprehensive, centralized dashboard outlining the absolute financial realities of the top reporting corporations.
Master Financial Toolbar
| Company Name | Q4 Net Profit / Loss (YoY) | Q4 Operational Revenue (YoY) | Operating Profit / EBITDA (YoY) | Key Corporate Action / Shareholder Reward | Closing Price on NSE (May 15, 2026) |
| Tata Steel | ₹2,926 Crore ($\uparrow$ 125%) | ₹63,270 Crore ($\uparrow$ 12.5%) | ₹9,828 Crore ($\uparrow$ 50%) | Final Dividend of ₹4 per share (400%); 23% stake buy in TMILL for ₹335 Cr. | ₹216.84 ($\downarrow$ 1.94%) |
| Hindustan Copper | ₹444 Crore ($\uparrow$ 132%) | ₹1,156 Crore ($\uparrow$ 58%) | ₹628 Crore ($\uparrow$ 135%) | Final Dividend of ₹1.86 per share; Board approved ₹500 Cr debt raising & QIP. | ₹570.00 ($\downarrow$ 6.00%) |
| Godfrey Phillips | ₹521.43 Crore ($\uparrow$ 86.7%) | ₹3,485.54 Crore ($\uparrow$ 84.63%) | ₹553 Crore ($\uparrow$ 104.8%) | Final Dividend of ₹33 per share (1650%); Signed distribution pact with Aspeya India. | ₹5,120.00* (Market Cap: ₹37,643.08 Cr) |
| Welspun Living | ₹104 Crore ($\downarrow$ 21%) | ₹2,435 Crore ($\downarrow$ 7%) | ₹249 Crore ($\downarrow$ 16%) | Share Buyback of 1.44 Cr shares @ ₹175/share; Dividend of ₹0.10/share. | ₹138.80 ($\uparrow$ 3.40%) |
| ITC Hotels | ₹316 Crore ($\uparrow$ 34%) | ₹1,243.88 Crore ($\uparrow$ 1.6%) | Flat Core Margins (Other Income: ₹1,306 Cr) | Final Dividend of ₹1 per share (Face Value ₹1); Record Date: May 21, 2026. | ₹155.48 ($\uparrow$ 0.08%) |
*Note: Stock price extrapolated based on final market capitalization and total outstanding shares.
Deep-Dive Analysis: Heavyweights Performance Breakdown
1. Tata Steel: Multifold Profit Surge Amid Global CrosswindsTata Steel delivered an exceptionally strong set of numbers for the final quarter of the financial year 2025-26, highlighting the inherent resilience of its domestic operations against a highly fragmented and volatile international macroeconomic environment.
Tata Steel Q4 FY26 | Key Performance Matrix
| Financial Metric | Q4 FY26 Absolute Value | Year-on-Year (YoY) Change | Visual Performance Indicator |
| Consolidated Net Profit | ₹2,926 Crore | ▲ +125.0% | 🟩🟩🟩🟩🟩🟩🟩🟩🟩🟩 (Explosive Growth) |
| Total Revenue | ₹63,270 Crore | ▲ +12.5% | 🟩🟩🟩🟩🟩🟩🟩🟩🟩🟩🟩🟩🟩 (Steady Scale) |
| Operating EBITDA | ₹9,828 Crore | ▲ +50.0% | 🟩🟩🟩🟩🟩🟩🟩 (Strong Execution) |
| EBITDA Margin | 15.53% | ▲ +386 bps | Expanded from 11.67% YoY |
Executive Analysis: Tata Steel Q4 & FY26 Performance Breakdown
Part 1: The Corporate Bottom-Line (Net Profit Analysis)
The quarter ended March 31, 2026, marked an incredible turnaround for the Mumbai-headquartered steel giant’s profitability, primarily driven by strong pricing power and cost optimization in its domestic segments.
Q4 FY26 Consolidated Net Profit: ₹2,926 Crore
Q4 FY25 Consolidated Net Profit: ₹1,301 Crore (Year-on-Year Baseline)
Net Profit Growth Rate: ▲ 125% Year-on-Year
Key Insight: Profitability more than doubled over the previous fiscal year’s final quarter, proving that the company’s cost-transformation strategies successfully offset severe international macroeconomic crosswinds.
Part 2: Top-Line Trajectory (Revenue from Operations)
Tata Steel maintained its steady expansion path, driven by a resilient infrastructure environment inside India.
Q4 FY26 Total Revenue: ₹63,270 Crore
Q4 FY25 Total Revenue: ₹56,218 Crore (Year-on-Year Baseline)
Revenue Growth Rate: ▲ 12.5% Year-on-Year
Key Insight: The 12.5% expansion showcases a healthy volume-led top-line surge, ensuring a robust cash-generation rhythm despite softening product prices in traditional European export zones.
Part 3: Domestic Manufacturing Powerhouse (Crude Steel Production)
The company’s manufacturing divisions pushed operational capacities to fresh heights to meet aggressive development timelines across subcontinental industrial hubs.
Q4 FY26 India Crude Steel Production: 6.22 Million Tonnes
Production Velocity: ▲ 14% Year-on-Year Increase
Key Insight: This substantial 14% production ramp-up outlines optimized factory capacity utilization across the company’s major domestic smelting hubs, successfully outstripping standard industry run-rates.
Part 4: Record-Breaking Market Penetration (Domestic Deliveries)
Increased structural output translation meant that supply matching across the automotive, infrastructure, and retail distribution channels reached unprecedented scales.
Q4 FY26 India Dispatch/Deliveries: 6.19 Million Tonnes
Performance Milestone: Best-Ever Quarterly Deliveries in the history of Tata Steel India.
Key Insight: Strong alignment with central government capital expenditure plans and nationwide industrial projects allowed the company to immediately offload its peak production volumes with zero inventory stagnation.
Part 5: Complete Fiscal Year Matrix (Full-Year FY26 Financials)
Looking at the larger picture over the entire 12-month operating cycle reveals a solid, battle-tested balance sheet that actively absorbed international macro-shocks.
Full-Year FY26 Consolidated Revenue: ₹2,32,140 Crore
Full-Year FY26 Consolidated EBITDA: ₹34,848 Crore
Full-Year Operational Margin Growth: ▲ 35% Year-on-Year Increase
Key Insight: Despite a volatile and fragmented global market characterized by tariff disruptions and high geoeconomic uncertainties, the full-year EBITDA jump of 35% proves that Tata Steel’s focus on operational discipline has effectively built a resilient, multi-geography business model.
📊 Summary Dashboard: Tata Steel At A Glance
[ SEGMENT ] -------------- [ PERFORMANCE METRIC ] -------------- [ GROWTH STATUS ]
 Net Profit Margin       ₹2,926 Crore (Single Quarter)         ▲ +125% YoY
 Operational Revenue     ₹63,270 Crore (Single Quarter)        ▲ +12.5% YoY
 Factory Output           6.22 Million Tonnes (Crude Steel)     ▲ +14% YoY
 Consumer Deliveries     6.19 Million Tonnes (Best Ever)       ⭐ Historic Peak
====================================================================================
 Full Fiscal Year FY26   Revenue: ₹2,32,140 Cr | Operating EBITDA: ₹34,848 Cr (+35
The European Conundrum: A Tale of Two Geographies
[ SUBSIDIARY ] ---------- [ REVENUE ] ---------- [ EBITDA ] --------- [ PRIMARY CHALLENGE ]
Netherlands                       €1,605 Mn                  +€58 Mn                 €20 Mn+ Emission Penalties
United Kingdom                 £470 Mn                     -£48 Mn                    Subdued Demand
2. Hindustan Copper: Surging Global Commodity Prices Fuel 132% Profit ExplosionState-run miner Hindustan Copper (HCL) turned out to be one of the brightest spots in the metal space this earnings season, capitalizing beautifully on the worldwide commodity upcycle.
Hindustan Copper Q4 FY26 | Financial Highlights
| Financial Metric | Q4 FY26 Absolute Value | Year-on-Year (YoY) Change | Visual Performance Indicator |
| Standalone Net Profit | ₹444 Crore | ▲ +132.0% | 🟩🟩🟩🟩🟩🟩🟩🟩🟩 (Profit More Than Doubled) |
| Operational Revenue | ₹1,156 Crore | ▲ +58.0% | 🟩🟩🟩🟩🟩🟩🟩🟩🟩🟩🟩🟩 (Strong Top-Line Surge) |
| Operating EBITDA | ₹628 Crore | ▲ +135.0% | 🟩🟩🟩🟩🟩🟩🟩 (Massive Core Efficiency) |
| EBITDA Margin | 54.30% | ▲ +1800 bps | Expanded by 18.0% Percentage Points |
Bottom-Line & Top-Line Growth
Standalone Net Profit: ₹444 Crore — An astronomical ▲ 132% YoY jump compared to ₹191 Crore in the same period last fiscal.
Revenue from Operations: ₹1,156 Crore — Climbed ▲ 58% YoY from ₹731 Crore in the year-ago quarter.
Full-Year Net Profit (FY26): ₹921 Crore — Nearly doubled with a massive ▲ 96% YoY surge from ₹369 Crore in FY25.
Exceptional Operating Efficiency
Operating Profit (EBITDA): ₹628 Crore — Skyrocketed by ▲ 135% YoY.
EBITDA Margin: Finished at an enviable 54.3%, expanding by a whopping 1,800 basis points (18 percentage points) due to highly optimized operational performance.
Catalysts & Future Capital Requirements
The stellar bottom-line growth was primarily driven by international copper prices hovering at elevated levels. Copper demand has skyrocketed globally due to its irreplaceable role as a primary raw material in manufacturing microchips, advanced electronics, and semiconductors required to power the global Artificial Intelligence (AI) structural megatrend.
To fund its ambitious capacity expansion plans, the company’s board has sought shareholder approval to raise up to ₹500 crores through convertible or non-convertible debentures. Additionally, the miner intends to dilute equity to institutional players via a Qualified Institutional Placement (QIP) of up to 9.69 crore equity shares.
On the regulatory front, the company updated stakeholders that the execution of a lease deed for land at its Gujarat Copper Project (GCP) in Jhagadia (gross carrying value of ₹48.20 crores remains stuck in legal limbo, with a writ petition currently pending before the Gujarat High Court. Ahead of the earnings call, the stock closed 6% lower at ₹570 amid the intense across-the-board market sell-off.
3. Godfrey Phillips India: Cigarette Volumes Spark 87% Surge in Net ProfitFMCG and tobacco manufacturing major Godfrey Phillips India (GPI) put up a spectacular show in Q4FY26, heavily beating street estimates across all key financial operational parameters.
Financial Performance Review
The flagship company of the KK Modi Group posted an 86.7% year-on-year surge in consolidated net profit, which climbed to ₹521.43 crores for the quarter ended March 31, 2026, up from ₹279.29 crores in Q4FY25. Total revenue from operations experienced a major lift, rising 84.63% to hit ₹3,485.54 crores compared to ₹1,887.79 crores in the year-ago quarter.
The operational profitability of the company expanded significantly, with EBITDA rising 104.8% to ₹553 crores and margins moving up to 9.9% from 6.8% YoY.
Godfrey Phillips | Segment Revenue Share (Q4 FY26)
| Segment Category | Q4 FY26 Revenue | Revenue Share (%) | Visual Volume Indicator |
| 🚬 Cigarettes & Tobacco | ₹3,461.81 Crore | 99.32% | 🟥🟥🟥🟥🟥🟥🟥🟥🟥🟥🟥🟥 (Core Driver) |
| 📦 Other Segments | ₹23.73 Crore | 0.68% | 🟦 (Retail & Others) |
| Total Revenue | ₹3,485.54 Crore | 100.00% | Consolidated Operations |
Segment Performance & Leadership CommentaryThe performance was almost entirely anchored by the core cigarettes, tobacco, and related products division, which grew 85.53% year-on-year to generate ₹3,461.81 crores in revenue. Non-tobacco consumer segments registered a modest 8.36% growth, bringing in ₹23.73 crores
CEO Sharad Aggarwal noted that domestic cigarette volumes grew by an impressive 20% over the full fiscal year. Unmanufactured tobacco exports also emerged as a powerful engine of growth, hitting ₹1,945 crores and accounting for 21% of total net sales revenue.
Looking forward, Aggarwal cautioned that sharp hikes in tobacco taxation enacted during Q4FY26 would likely make FY27 a challenging year. However, the company plans to pass on the tax incidence via phased, strategic price increases rather than a single disruptive price shock.
Corporate Distribution Tie-Up & Massive Dividend
In a significant corporate development, the board gave its nod to enter into a long-term, 3-year distribution agreement with Aspeya India Private Limited. Aspeya India is a member entity of global tobacco giant Philip Morris Global Brands Inc., USA (the foreign promoter shareholder of Godfrey Phillips). Under this partnership, Godfrey Phillips will purchase and utilize its massive domestic retail footprint to distribute and sell nicotine replacement therapy products across approved Indian trade channels.
To reward investors, the board recommended a final dividend of ₹33 per equity share (a massive 1,650% on a face value of ₹2). Combined with the interim dividend of ₹17 per share declared in November 2025, the total shareholder reward for FY26 stands at a substantial ₹50 per share.
4. Welspun Living: Navigating Global Headwinds via Structural Share BuybacksUnlike its metal and tobacco counterparts, home textiles major Welspun Living encountered a demanding operating environment in the final quarter, characterized by intense geopolitical turbulence and fluctuating consumer demand overseas.
Earnings Contraction & Trough Formations
The consolidated net profit of the textile manufacturer fell 21% year-on-year to ₹104 crores for Q4FY26, down from ₹132 crores in the year-ago period. Revenue from operations dropped 7% to ₹2,435 crores, while EBITDA contracted by 16% to ₹249 crores, driving down operating profit margins to 10.21%.
Welspun Group Chairman B.K. Goenka explained that US tariff uncertainties, shipping bottlenecks linked to conflicts in West Asia, and cautious international inventory management combined to create persistent challenges for the home textiles sector throughout the year.
Balance Sheet Strengthening & Renewable Energy Pivot
Despite the temporary dip in quarterly profits, the company’s structural turnaround remains firmly on track. Welspun reduced its net debt by over 50% in FY26, while generating an 8.5x increase in free cash flow, which reached ₹956 crores. A sequential revenue recovery of 7.7% between Q3 and Q4 indicates that the company has likely left its operational bottom behind.
In a strategic sustainability move, Welspun Living approved the acquisition of 48,599 equity shares (a 26% stake) in CleanMax Dhyuthi Private Limited (CDPL) from group promoter firm Welspun Corp Limited for ₹760 lakhs. CDPL operates a dedicated captive renewable energy project in Gujarat, which will directly supply green power to Welspun’s large-scale manufacturing plant in Vapi.
Strategic Share Buyback Program Explained
To optimize its capital structure and return surplus cash to shareholders, the board approved an aggressive equity buyback plan.
Total Buyback Size: Up to ₹252 crores.
Maximum Shares to be Repurchased: 1.44 crore fully paid-up equity shares.
Buyback Offer Price: ₹175 per share (offering a substantial premium over the current market price of ₹138.80).
Mechanism: Tender Offer Route on a proportionate basis.
Capital Impact: Represents 6.52% of standalone and 5.65% of consolidated paid-up equity capital and free reserves.
Record Date: May 22, 2026, has been designated as the cut-off date to establish shareholder eligibility.
5. ITC Hotels: Other Income Propels Bottom Line Amid Subdued Core Hospitality RevenuesThe newly listed hospitality pure-play ITC Hotels delivered a mixed set of financial numbers for the final quarter of FY26. A sharp rise in non-operating income ultimately salvaged the net profit figure, helping offset soft core hospitality operations.
ITC Hotels | Q4 FY26 Revenue Share & Net Profit Matrix
| Segment / Financial Metric | Q4 FY26 Value | Percentage Share / Growth | Visual Segment Indicator |
| 🏨 Hotel Business Income | ₹1,103.95 Crore | 88.75% | 🟦🟦🟦🟦🟦🟦🟦 (Core Revenue Engine) |
| 🏢 Real Estate Revenue | ₹129.00 Crore | 10.37% | 🟨🟨 (Premium Growth Component) |
| 📦 Other Segments | ₹10.93 Crore | 0.88% | ⬜ (Minor Operations) |
| Total Revenue from Operations | ₹1,243.88 Crore | 100.00% | Consolidated Top-Line |
| 💵 Consolidated Net Profit | ₹316.00 Crore | ▲ +34.0% YoY | 🟩🟩🟩🟩 (Driven by Other Income) |
The hotel operator reported a 34% year-on-year increase in its consolidated net profit (attributable to owners), which climbed to ₹316 crores from ₹235 crores in the year-ago period. However, core revenue growth remained largely flat, ticking up just 1.6% to reach ₹1,243.88 crores}$ compared to ₹1,224.27 crores in Q4FY25.
A closer look at the financial statements reveals that this profit growth was primarily driven by a substantial increase in “Other Income,” which reached ₹1,306 crores during the quarter under review, up from ₹1,280 crores in the prior-year period. This boost helped lift Earnings Per Share (EPS) to ₹1.52 from ₹1.13.
Segment Performance Breakdown
The core hospitality business experienced modest operational pressure, with quarterly segment revenue dipping 2.5% year-on-year to ₹1,103.95 crores down from ₹1,132.51 crores. Net profits from direct hotel operations also slipped 4.3% to ₹322 crores.
Fortunately, the company’s premium real estate segment stepped in to cushion the blow, with revenues jumping 58% to ₹129 crores and segment profits climbing 43% to ₹38 crores.
The board recommended a final dividend of ₹1 per equity share of face value ₹1 for the fiscal year, subject to shareholder approval at the company’s upcoming 3rd Annual General Meeting on August 6, 2026. The record date to determine eligibility has been set for Thursday, May 21, 2026.
Technical Outlook & Market Strategy: Navigating the Volatility
With the Nifty 50 breaking through key technical support lines and the Sensex giving up major psychological levels, the near-term market structure has turned decidedly cautious. Experienced market participants will likely closely monitor key underlying indicators to evaluate potential stabilization zones.
            NIFTY 50 TECHNICAL BREAKDOWN RISK

   24,200 +---------------------------------------+
          |  * *   (Fortnight Highs)              |
   24,000 |      *                                |
          |       *                               |
   23,800 |        *                              |
          |---------*-----------------------------| <-- Previous Strong Support
   23,643 |          *                            | <-- Current Friday Close
          |           \                           |
   23,400 +------------\--------------------------+
          |             V                         | <-- Next Crucial Target Support
          +---------------------------------------+
                     May 15, 2026
Key Technical Support Levels to Watch
Nifty 50 Support Coordinates: Following the breach of the crucial 23,800 zone, the index is vulnerable to further downside, with the next strong historical demand zones located around 23,450 and 23,200. On any minor technical rebounds, 23,900 will now act as a stiff overhead resistance zone.
Sensex Support Coordinates: Having dropped below 76,000, the index needs to stabilize around the 74,800–74,500 band to prevent deeper corrective liquidations.
Investment Summary & Actionable Strategy
The sharp disconnect between dropping index values and fundamentally strong Q4 corporate earnings highlights the importance of a selective investment approach. High-yielding, cash-rich consumer and metal stocks—such as Godfrey Phillips and Hindustan Copper—continue to show robust underlying operational strength, making them attractive options to watch for long-term investors looking to accumulate quality assets on market dips.
Conversely, export-reliant companies and international business divisions continue to face headwinds from global supply chain disruptions and shifting tariff structures. Investors may want to adopt a gradual, tiered accumulation strategy, focusing primarily on companies with strong domestic pricing power and resilient balance sheets until the broader indices show clear signs of stabilizing.
Disclaimer: This report is for informational purposes only. Please consult a certified financial advisor before making investment decisions based on the Q4 FY26 Earnings Fiesta data.